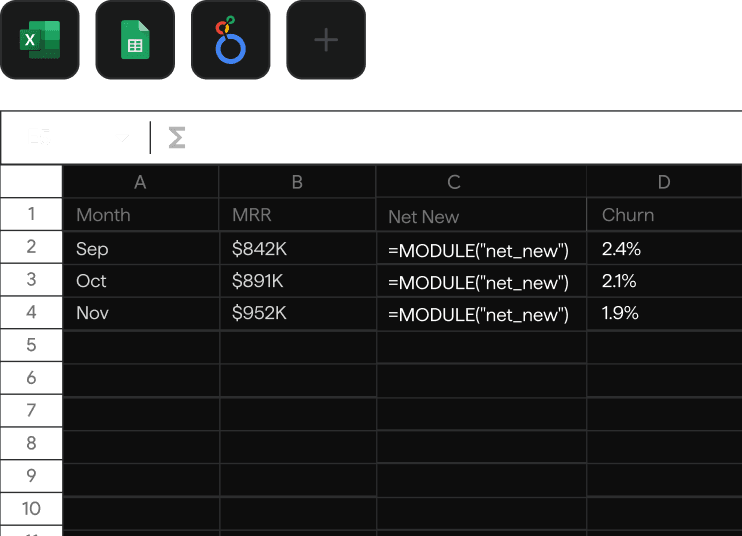
Analyze data in the tools you already use
Push reporting data directly to Excel, Sheets, Looker, or your BI tool of choice. No export-and-paste, no stale spreadsheets.
Every metric is computed from the same high-fidelity contract models that run your billing — real-time, fully auditable, and ready to analyze in the tools you already use.
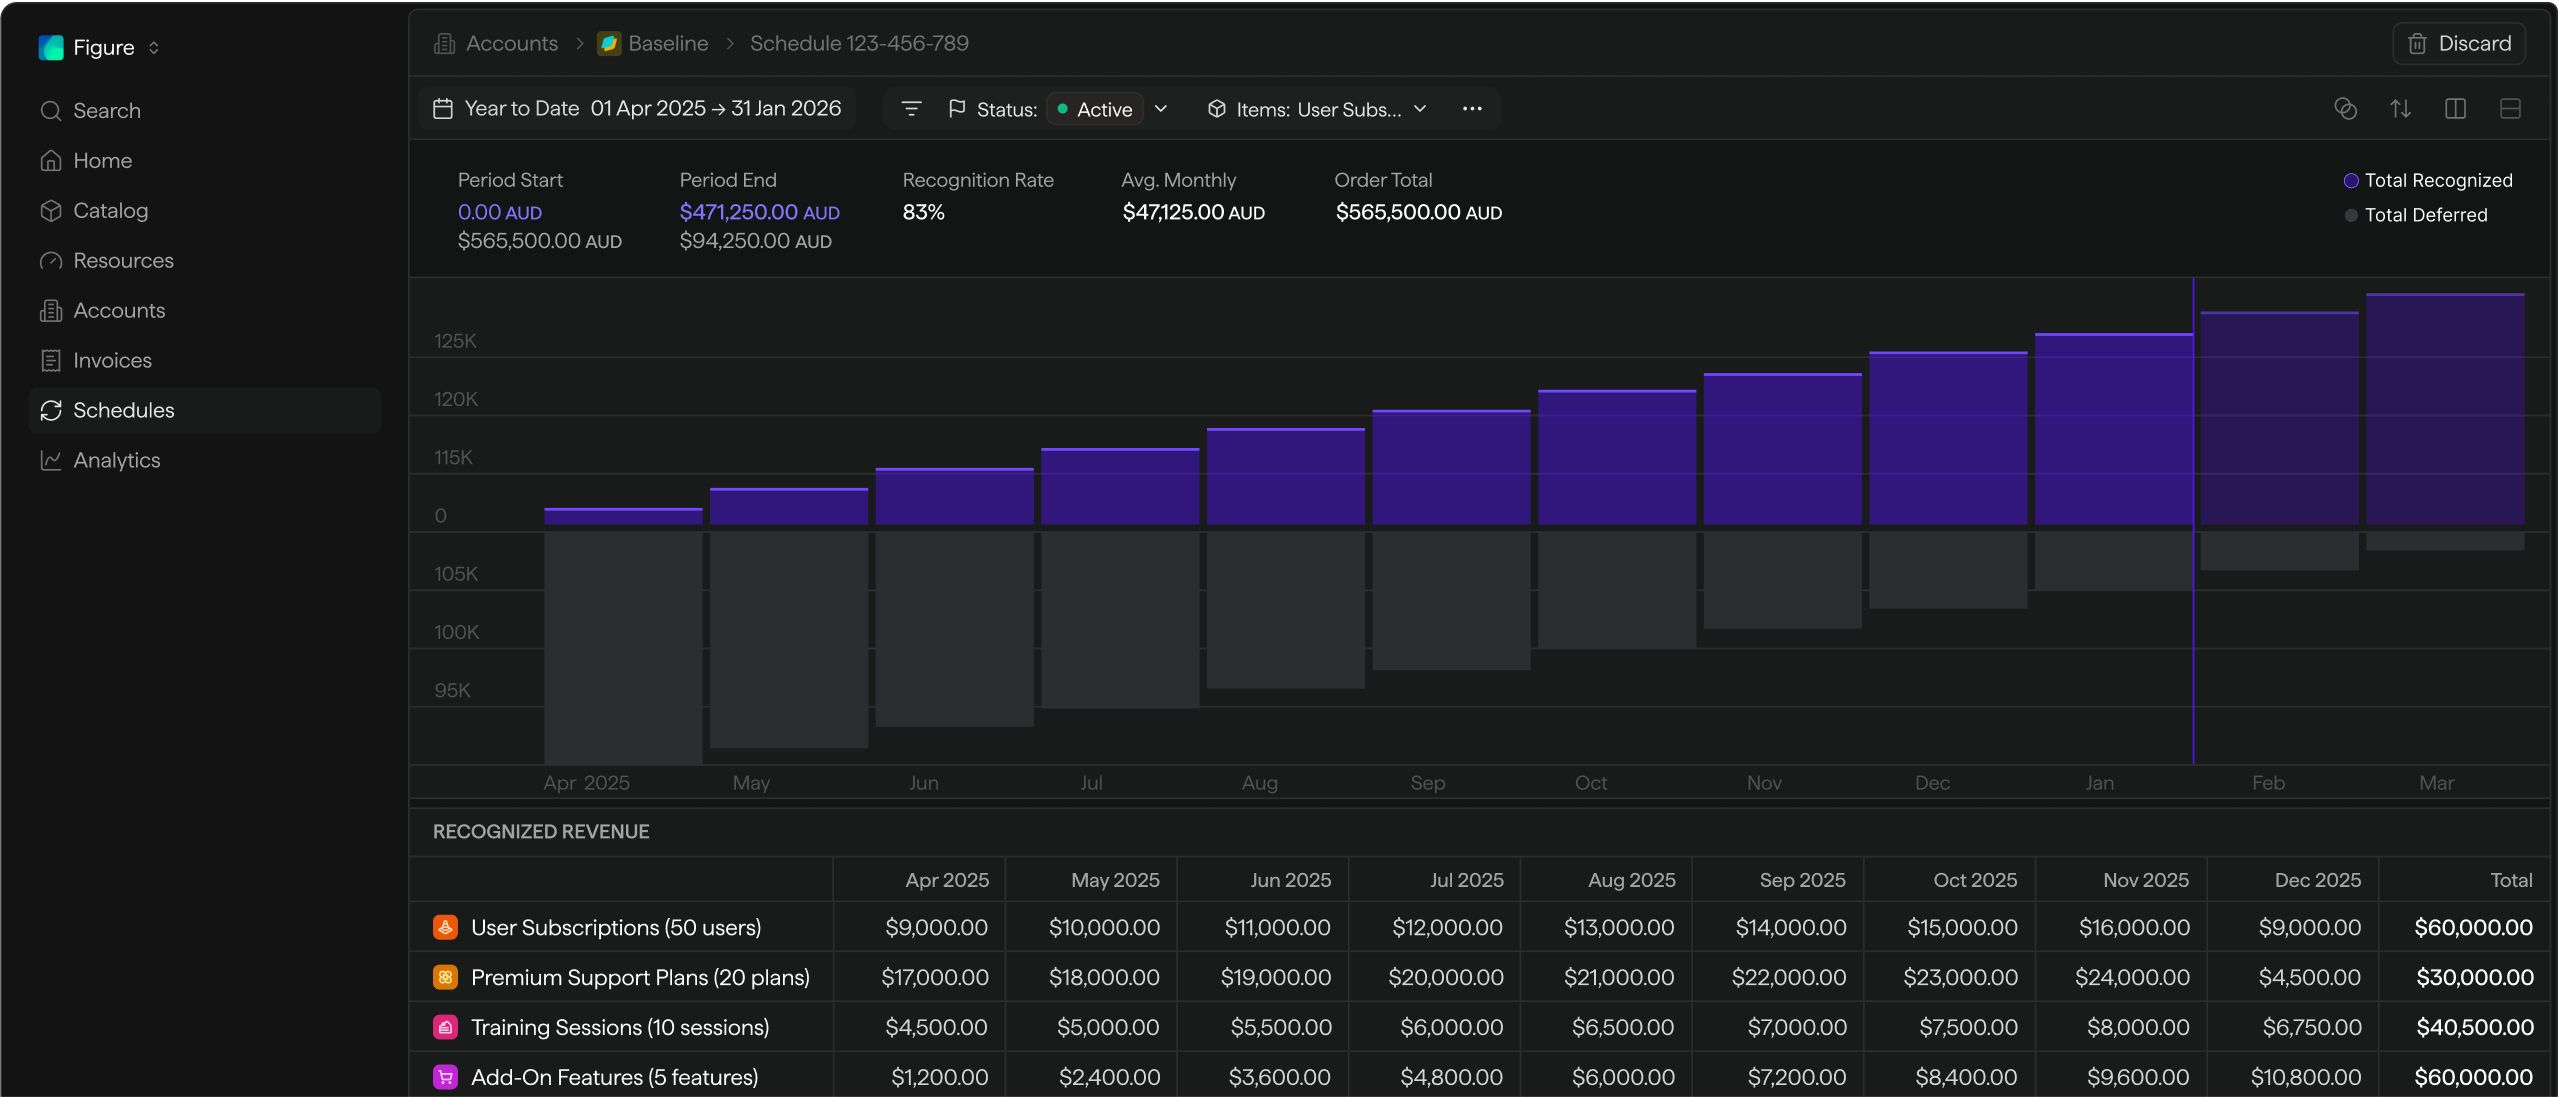
Reporting only matters if you act on it. Module turns a clean, trustworthy revenue line into the moments that move it — and shows you the lift each decision delivered.
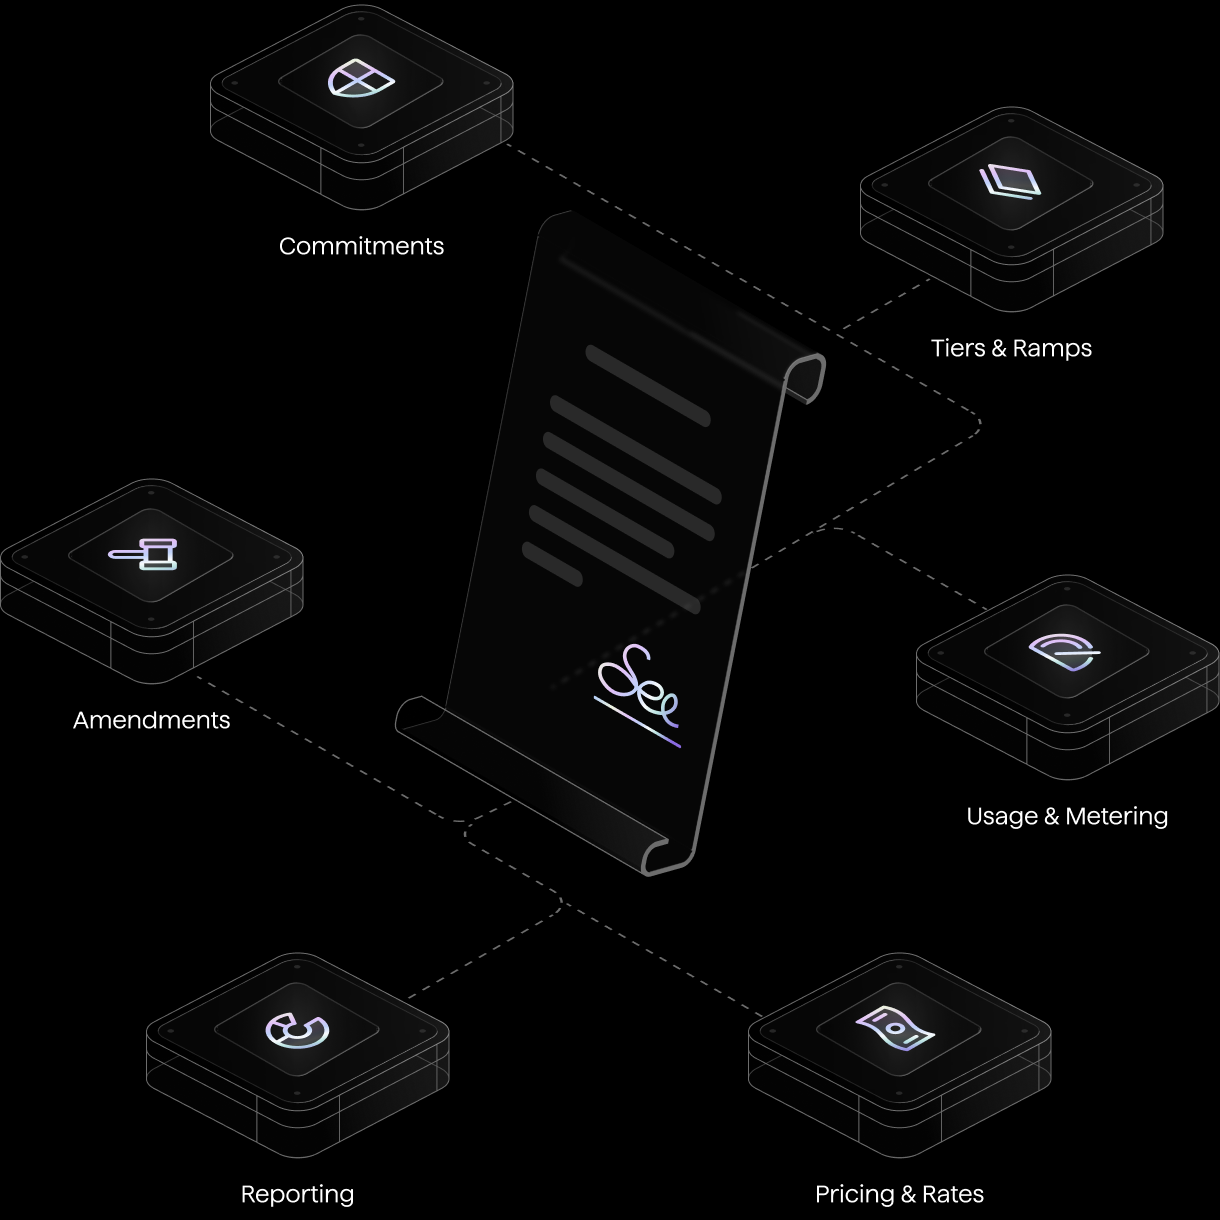
Module's reporting sits on Continuum — high-fidelity contract models that mirror exactly what was sold, amended, ramped and metered. No lossy summaries, no rounded approximations.
Tiers, ramps, commitments, usage and mid-term amendments are represented natively — not flattened into a single MRR figure.
Drill from portfolio down to a single line item or rate without losing fidelity, so every metric is explainable to the dollar.
The same model bills your customers and reports your revenue — so finance and product never argue about whose number is right.
Drill from portfolio to line item with complete fidelity. Every revenue number stays traceable to the contract that created it.
The data you need, in the tools you already use live, accurate, and covering every metric that matters. No custom pipelines, no waiting for exports.
Push reporting data directly to Excel, Sheets, Looker, or your BI tool of choice. No export-and-paste, no stale spreadsheets.
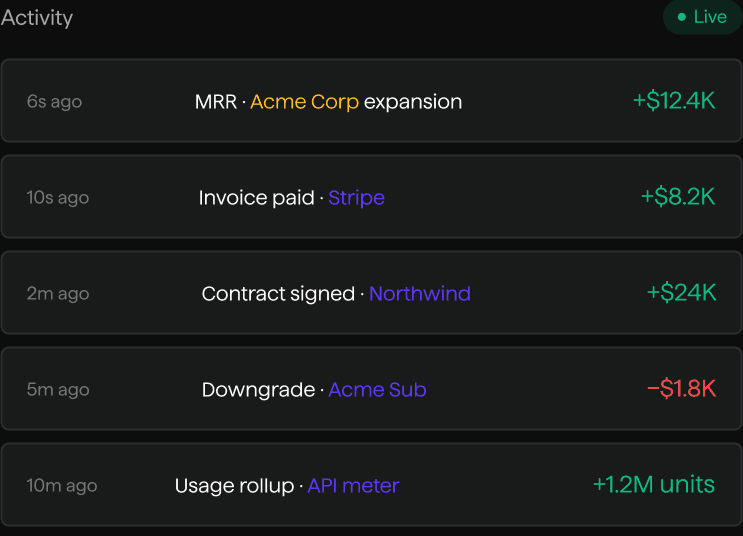
Every invoice, payment, and usage event updates your reports the moment it happens. No waiting for batch jobs, no stale dashboards at the morning standup.
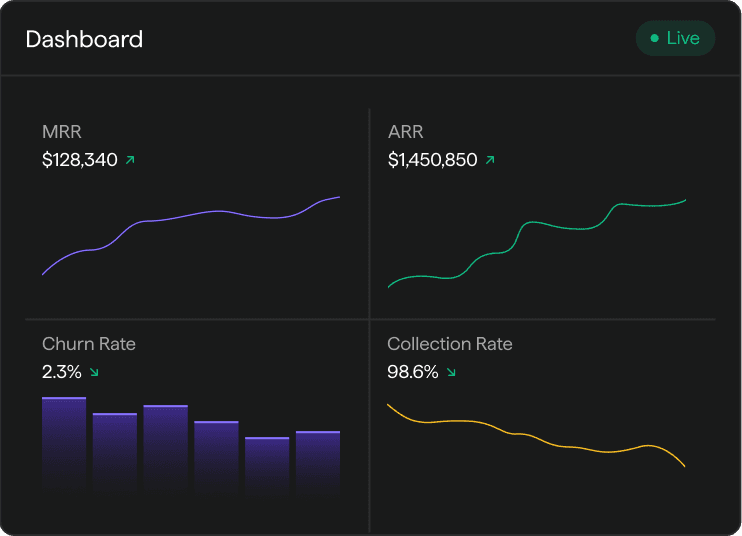
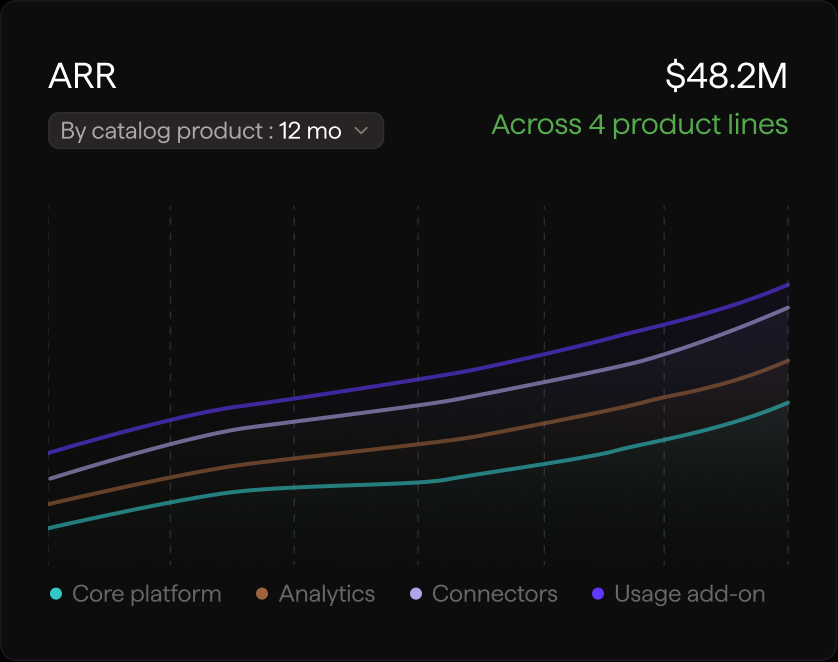
MRR, ARR, DSO, churn, collection rate, net revenue retention all calculated automatically from your billing data. Nothing to configure.
Module is the source of truth for revenue. Finance pairs it with the spreadsheet they already trust. Product pairs it with the BI tool they already use. Either way, the data stays in sync.

 Google Sheets
 Looker
 Excel
Excel Databricks
 Snowflake
Module is the revenue layer.
Not the whole P&L. We do this part deeply — and make sure your data flows cleanly into the tools that handle the rest.
As usage is metered and contracts change, Module re-rates and re-recognizes continuously. Open a report at 2:14pm and you're looking at 2:14pm — never last night's batch.
As usage is metered and contracts change, Module re-rates and re-recognizes continuously. Open a report at 2:14pm and you're looking at 2:14pm — not yesterday's close.
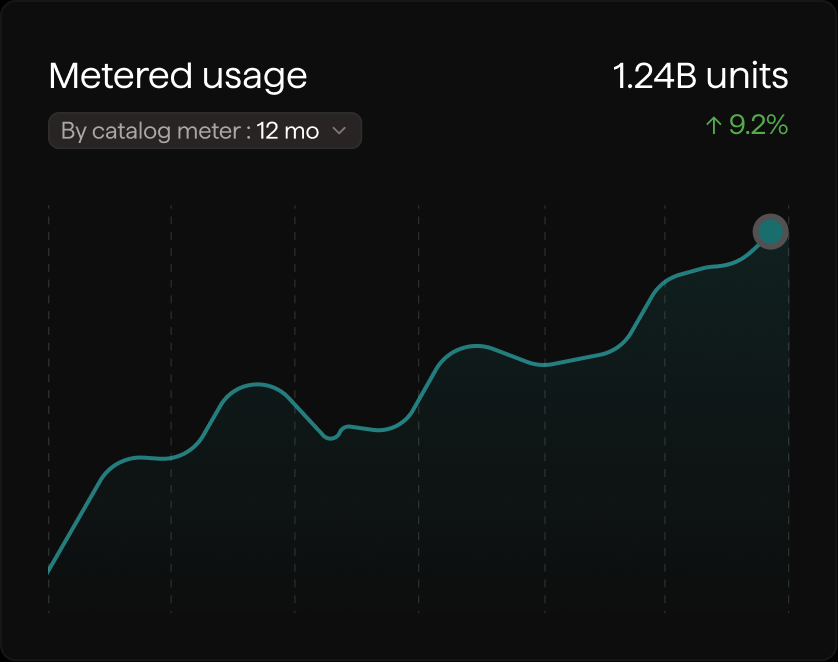
Events flow into recognized and deferred revenue the moment they're received.
New, expansion, contraction and churn update intraday so you spot a trend before quarter-end.
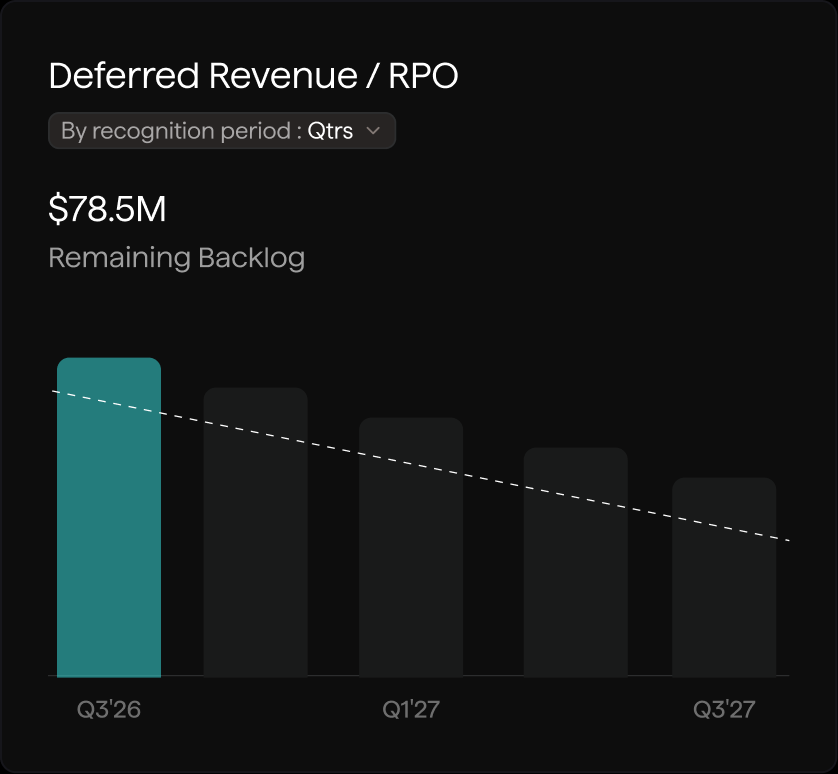
See recognized revenue, live movements and committed revenue update the moment they change — and act on them the same day, not three weeks later.
Recognized Revenue Today
$33,024.32
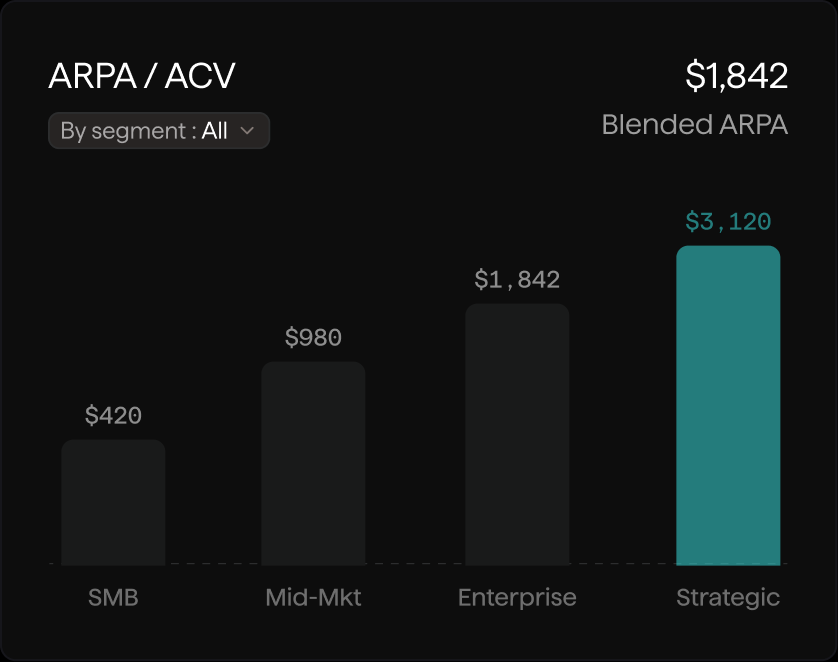
AUDARR, MRR, NRR, churn, expansion, LTV — all calculated directly from billing data, not assembled in spreadsheets. Always current, always accurate.
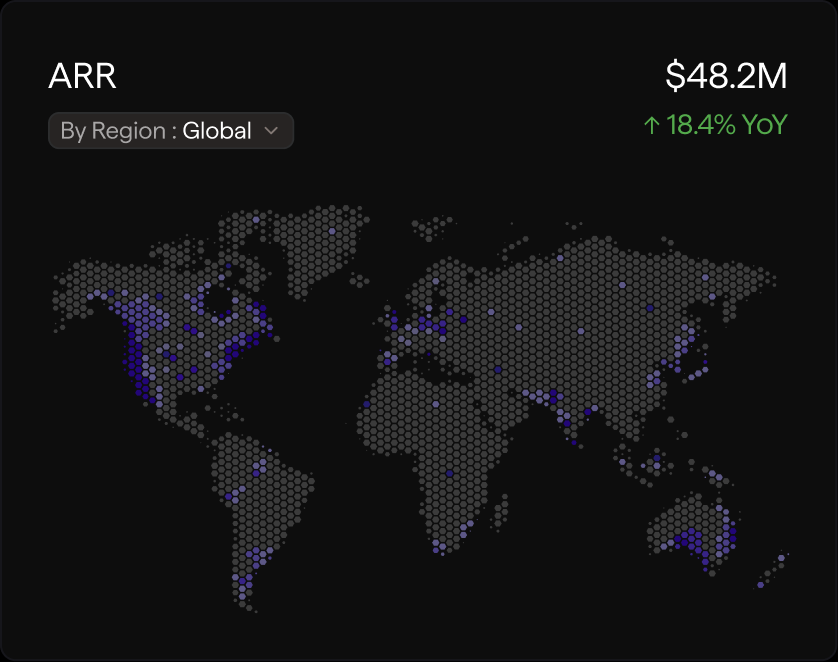
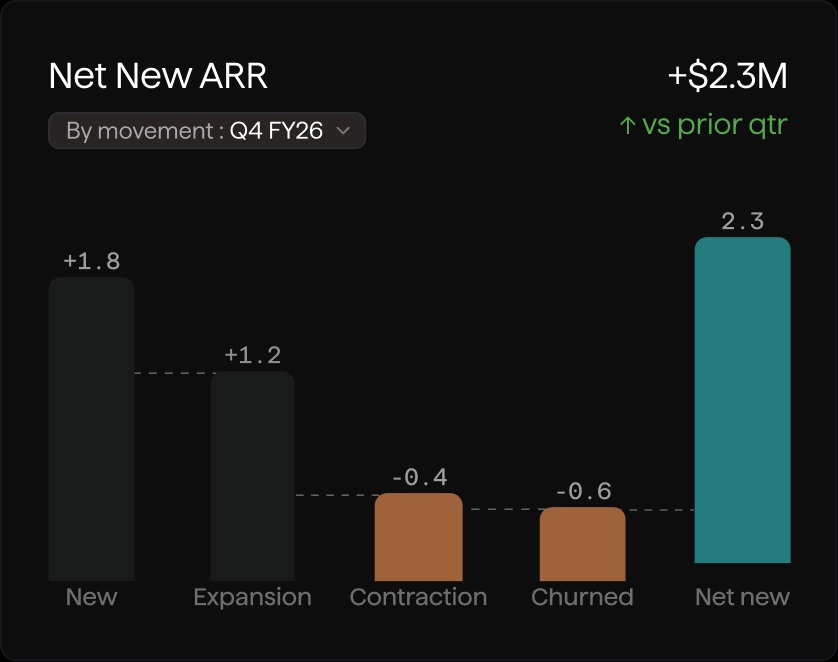
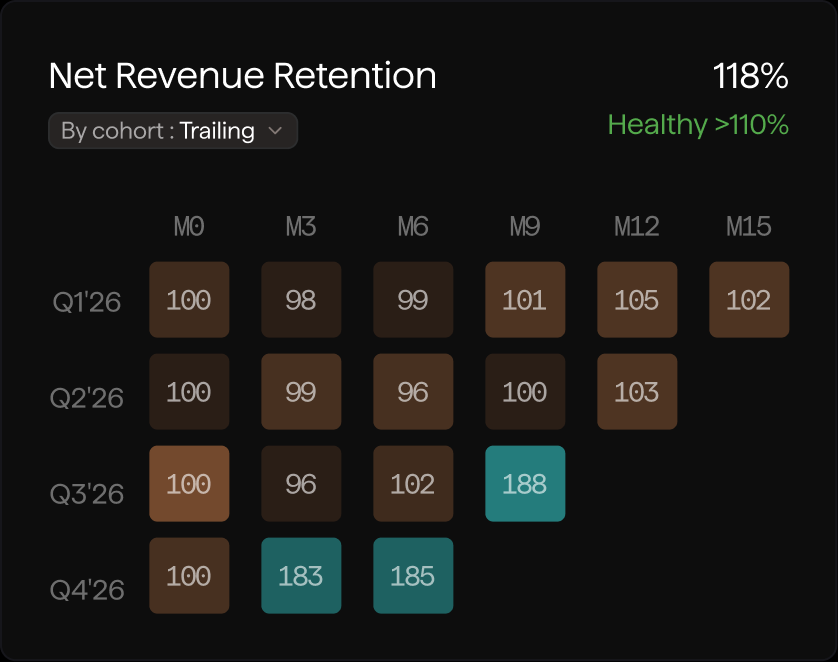
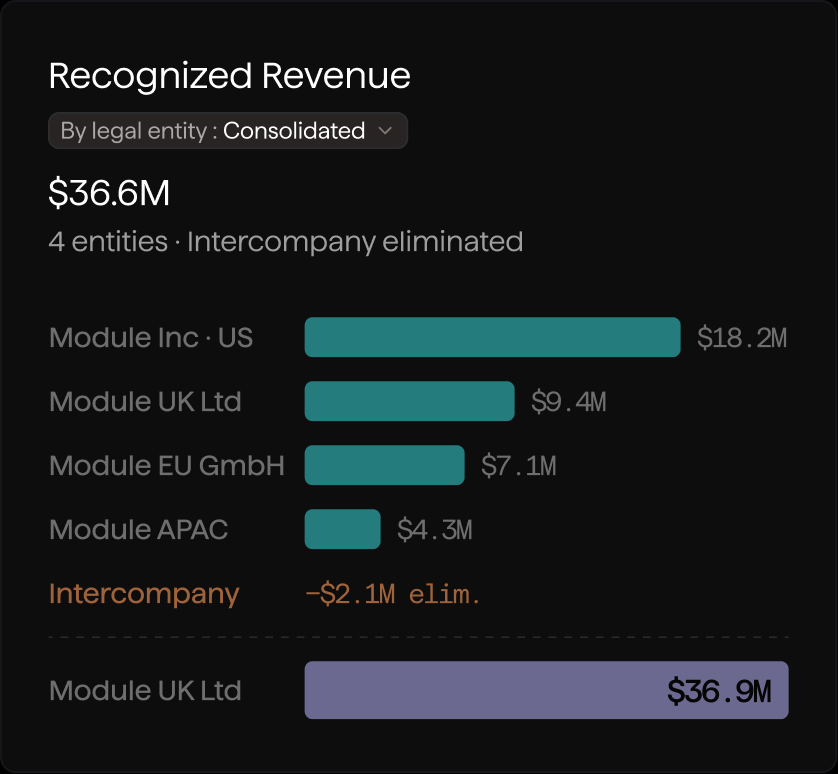
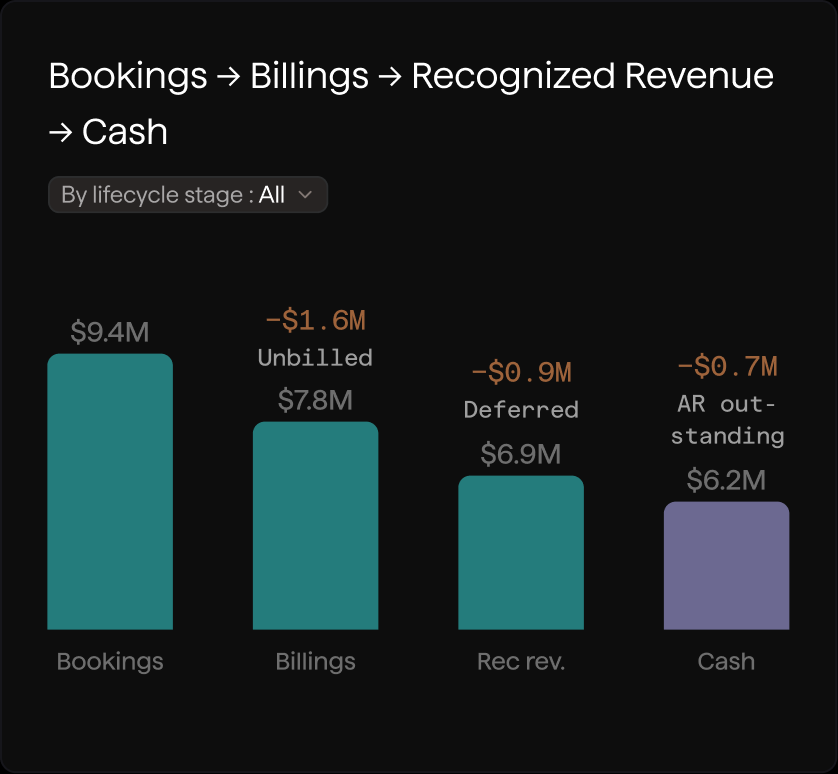
See Module compute your metrics from contract truth — in real time, in your own tools.


